User Guide
The following content provides a visual guide for users. If you prefer watching a video, please visit our YouTube channel: RuntimeHub for a video version of this guide.
Let's begin!
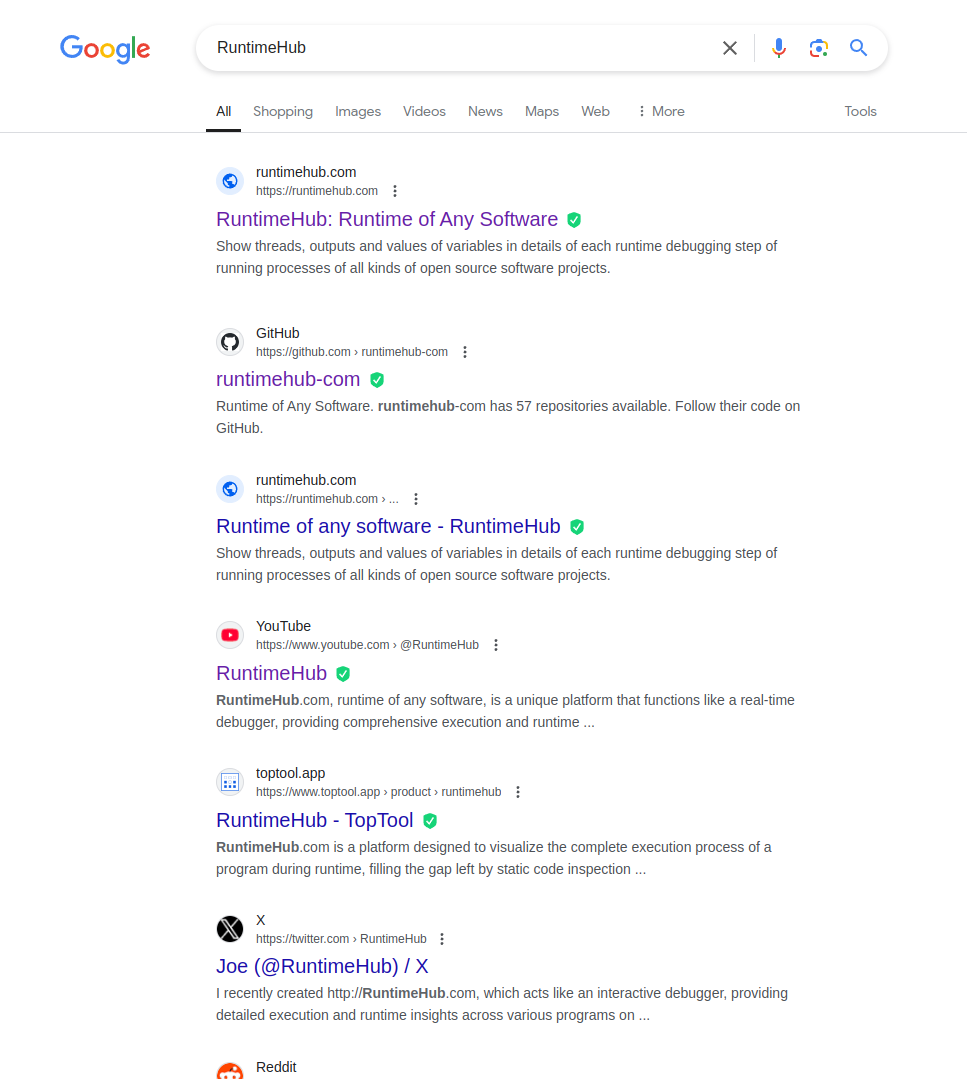
First, open the RuntimeHub homepage by entering runtimehub.com in your browser. You can also find the official RuntimeHub website by searching for "runtimehub" in Google, as shown in the image below:
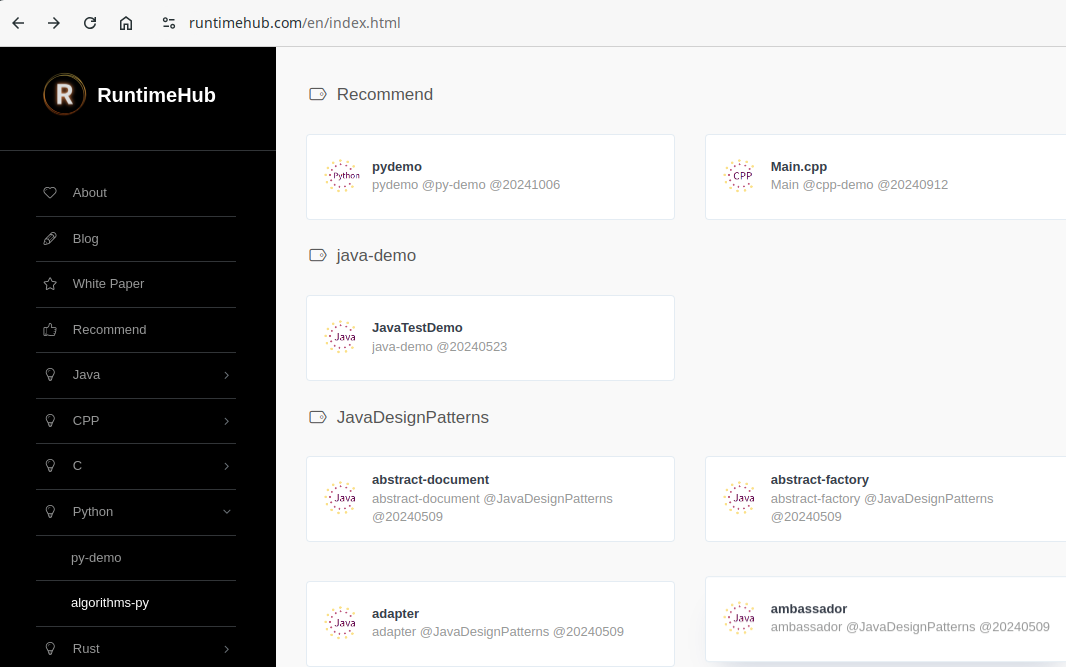
On the homepage, you’ll see a sidebar on the left featuring options like About, Blog, White Paper, Recommend, and lists of various programming languages, as shown here:
On the right side, there is a “Recommend” section featuring selected runtime examples. To get started with the basics, let’s click on the first Python Demo to access its page.
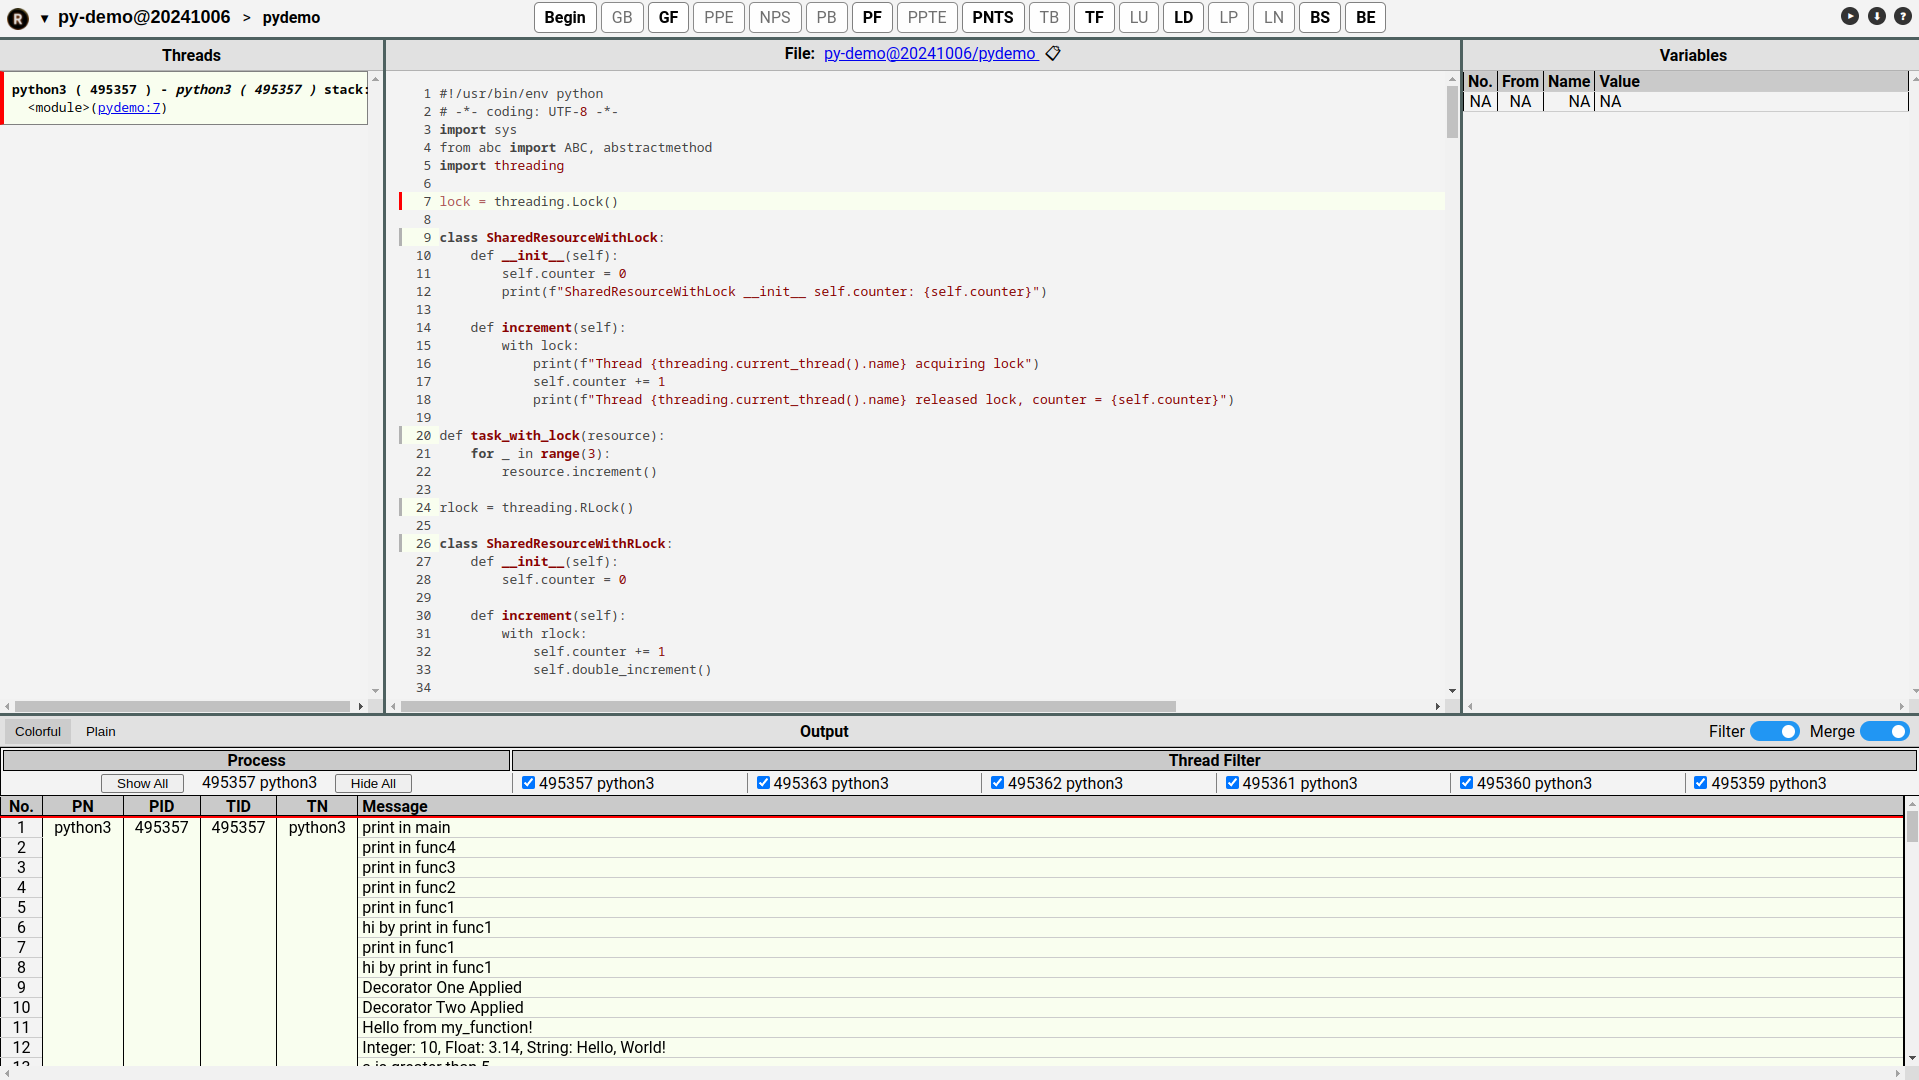
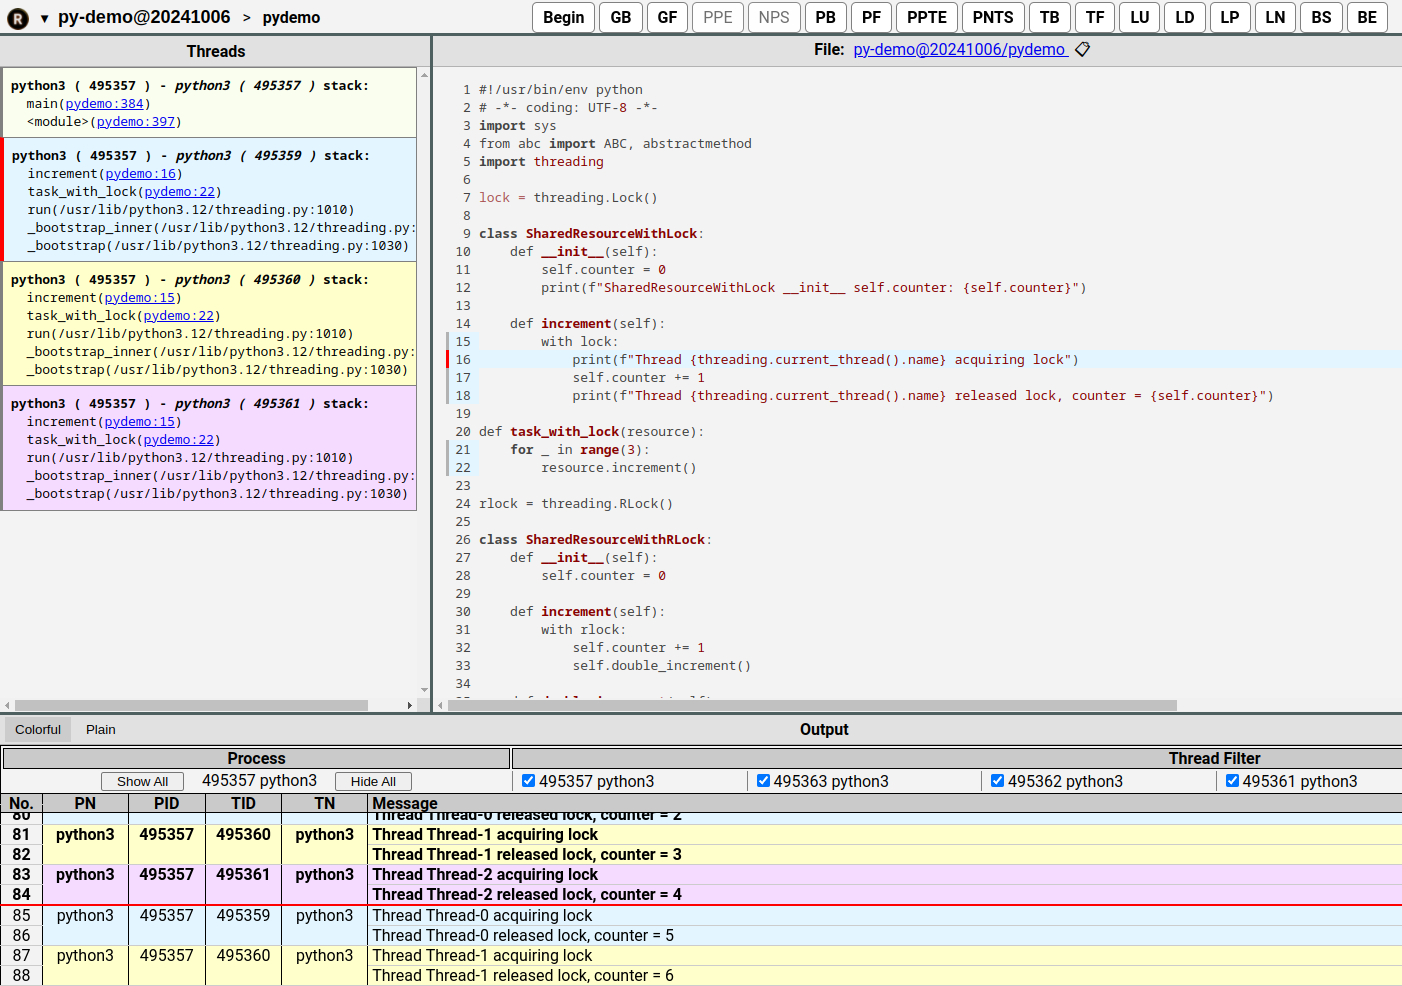
Upon entering the Python Demo, you will see the runtime for the first step of the `pydemo` program, presented in a relatively simple layout. The page is divided into five sections, which you can think of as sub-windows. Each sub-window’s size can be freely adjusted by dragging its separator with the mouse, just like desktop application windows.
Starting at the top-right corner of the navigation bar, you’ll see three buttons: a question mark, a download icon, and a play icon, from right to left. Let’s go over each:
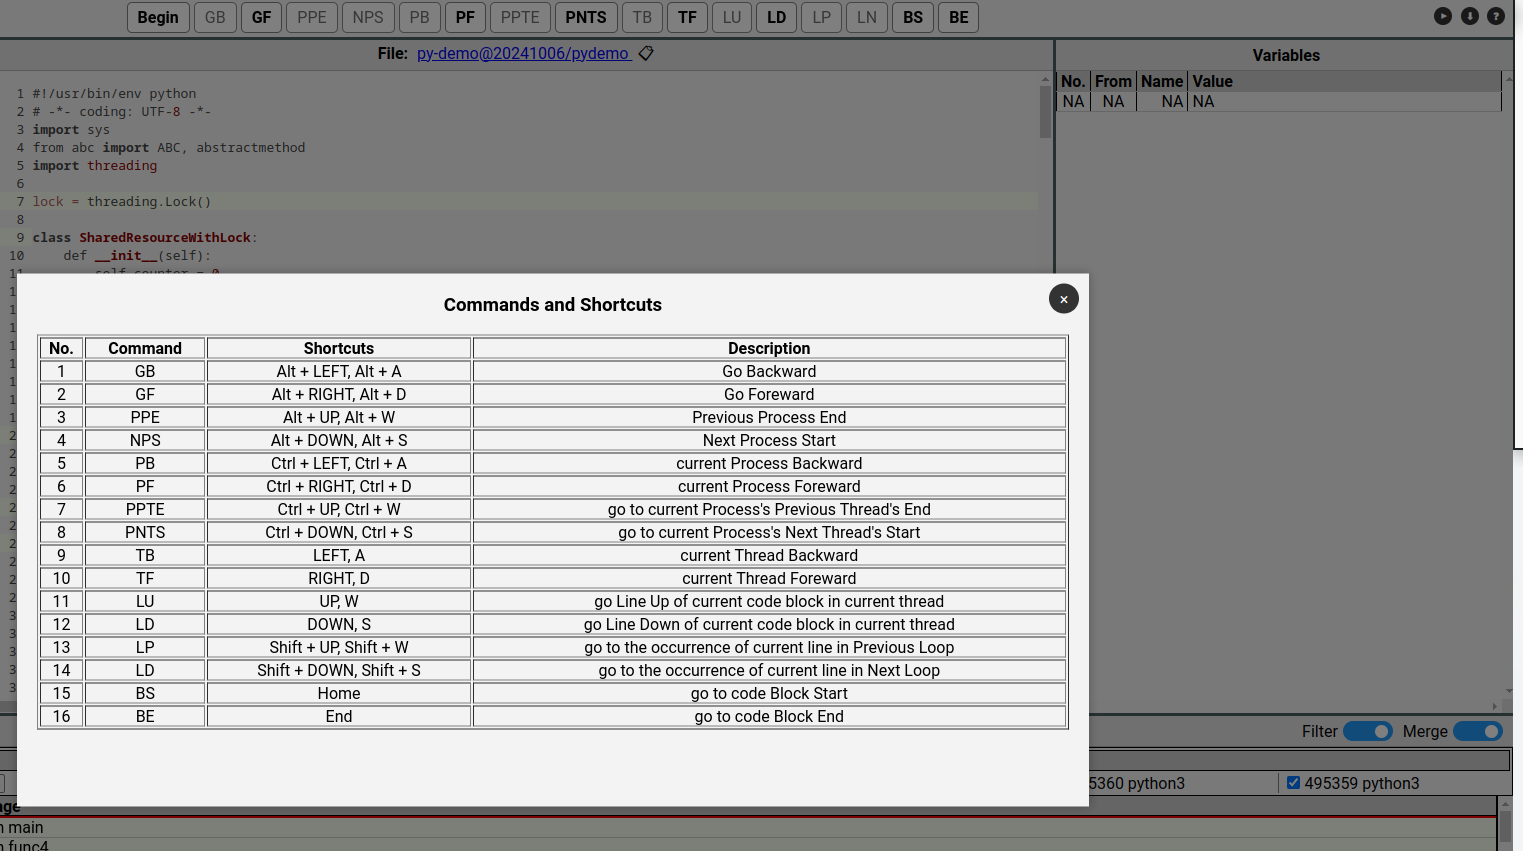
1. Question Icon This provides usage help. Clicking it opens a sub-window displaying a list of navigation commands and their shortcuts.
2. Download Icon This links to GitHub, allowing you to download or clone an offline HTML version of the project. To view it locally, open the `index.html` file in the folder named with "version.". This enables smooth browsing without internet speed issues. For an even better seamless experience, you can deploy these HTML files on a local web server like Apache or Nginx. This eliminates brief blank screens when switching between pages, providing an online-like experience.
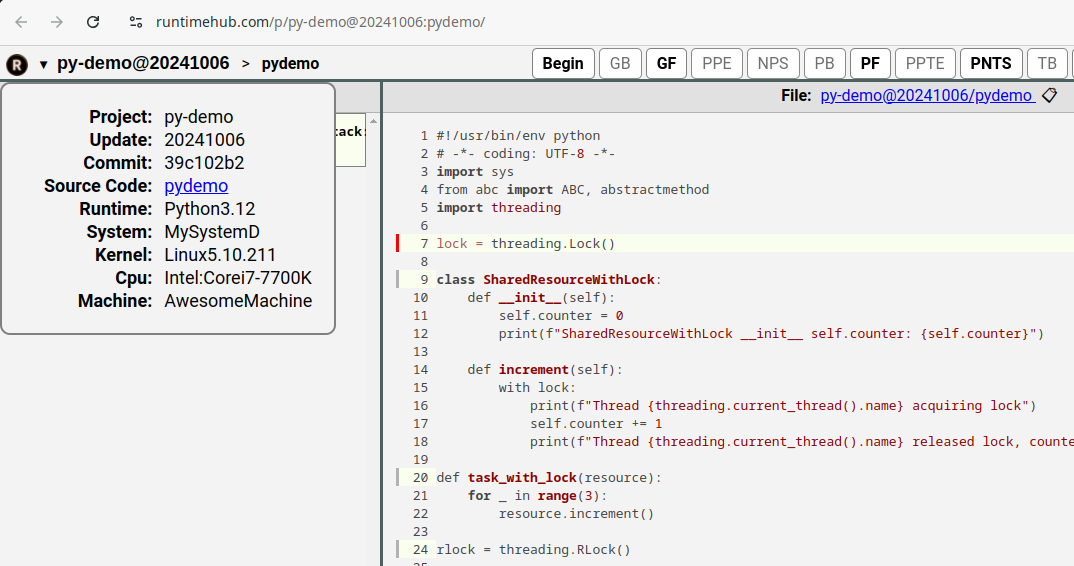
3. Play Icon This displays a recorded video of the entire runtime process. Available on our YouTube channel: RuntimeHub, it shows each execution step. Note that the "beep" sounds in the video are for engagement; you can mute if preferred or experience the interactive version on RuntimeHub.com without sounds. Links to the online version are provided in each video’s description.In the top-left corner of the navigation bar is the "RuntimeHub" logo, which you can click to return to the homepage. Next to the logo is the name of the current runtime, which opens a dropdown with detailed information:
We can see:
1. Project The name of the project this runtime belongs to.
2. Update The last update timestamp of the project’s source code.
3. Commit The last commit ID of the project’s source code.
4. Source The path to the source code on GitHub.
5. Runtime The runtime environment of the program, like Python3.12 for a Python program. For Java projects, it shows the JVM version. Note: For C/C++ or Rust, it may show the compiler version or none, as they run directly on the OS without a separate runtime.
6. System The operating system environment, Here, "MySystemD" is for a custom Linux distro based on SystemD.
7. Kernel The Linux kernel version, here Linux5.10.211.To close this dropdown, simply click the project name again.
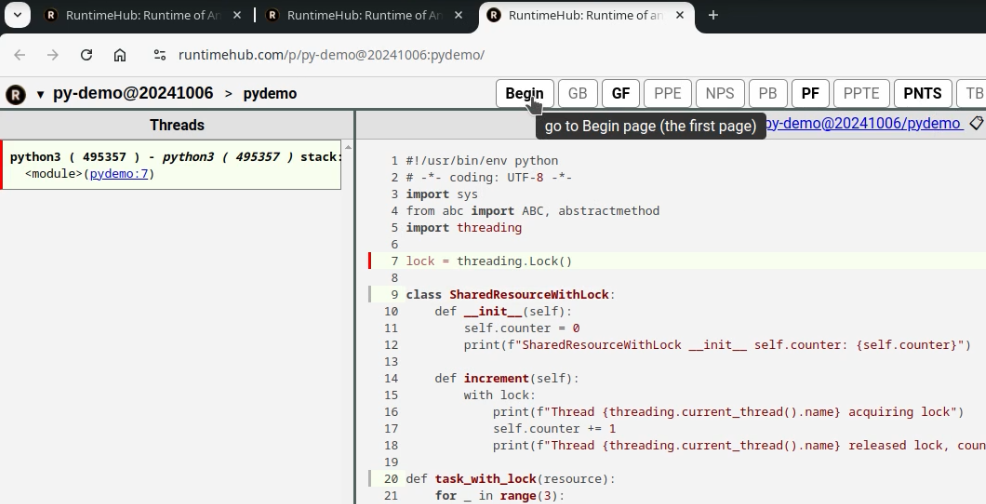
The central section of the top navigation bar has quite a few buttons for navigating between runtime stages. Hovering over each button displays a tooltip and shortcut:
Let's first look at the first navigation button on the left: "Begin". It represents the starting step of the execution. To make it easier to introduce the other navigation buttons to its right, let's click the question mark button in the top-right corner to open the table of navigation commands and shortcuts, as shown in the image below:
From the table above, we can see all the other navigation buttons:
01. GB : Go Back globally or Global Back )
02. GF : Go Forward globally or Global Forward )
03. PPE : Previous Process End
04. NPS : Next Process Start
05. PB : current Process Backward
06. PF : current Process Foreward
07. PPTE : go to current Process's Previous Thread's End
08. PNTS : go to current Process's Next Thread's Start
09. TB : current Thread Backward
10. TF : current Thread Foreward
11. LU : go Line Up of current code block in current thread
12. LD : S go Line Down of current code block in current thread
13. LP : go to the occurrence of current line in Previous Loop
14. LD : go to the occurrence of current line in Next Loop
15. BS : go to code Block Start
16. BE : go to code Block End
Note: When the navigation buttons above are displayed in a gray, non-clickable state, it indicates that the corresponding target does not exist and therefore cannot be clicked.Now, we have introduced all the navigation buttons, which should be easy to understand for programmers. In addition to the navigation buttons located in the navigation bar, there are other ways to navigate or jump within the interface, which will be introduced separately below:
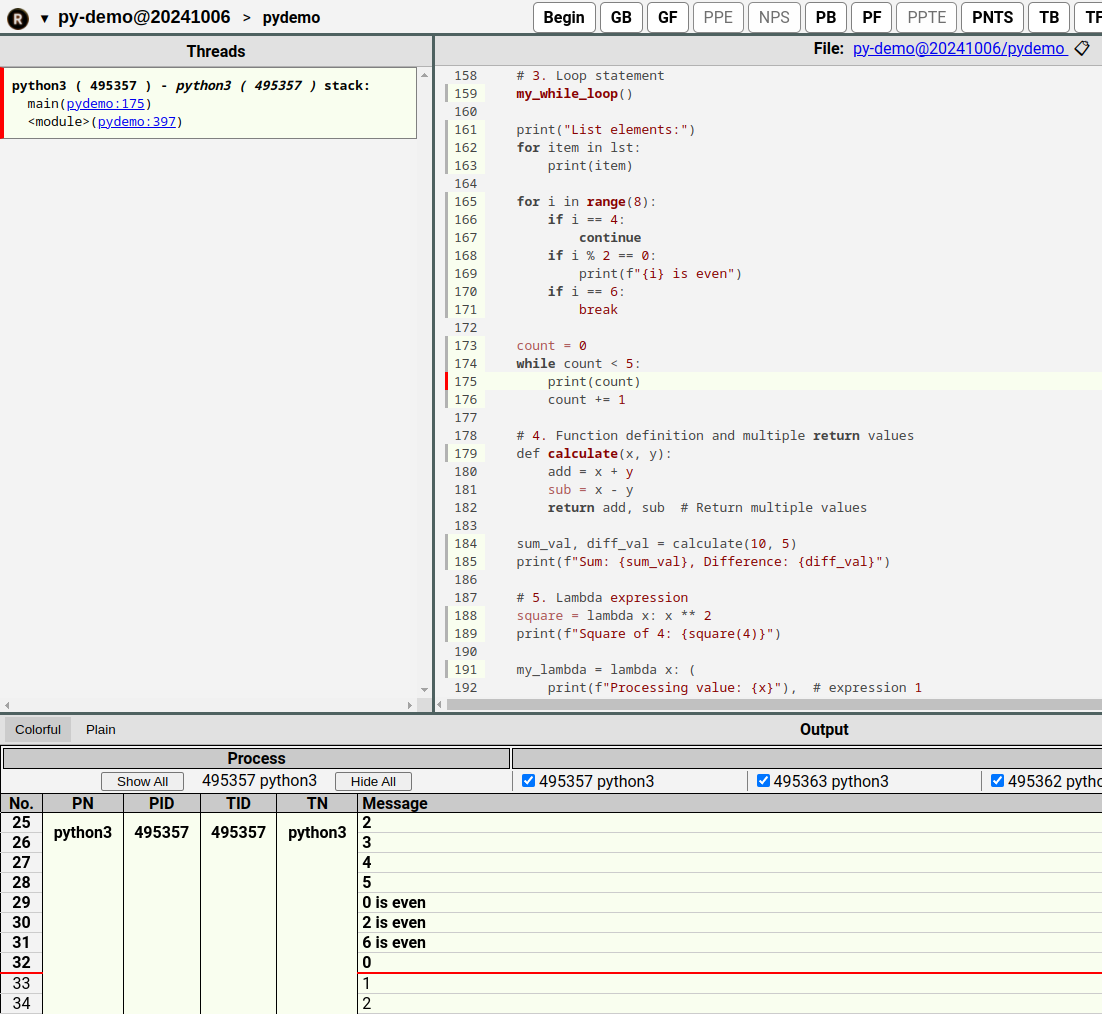
1. Every row in the output table in the output sub-window can be double-clicked to quickly jump to the position before the print statement for that row is executed. For example, we can double-click on line 33 to jump to the location where the print statement for that line is executed. Note that when double-clicking line 33, you need to double-click on the blank area of the row, not on the text part, because double-clicking on the text part will only select the text, not trigger the jump. After double-clicking on the blank area, it will automatically jump to the state before the print statement for line 33 is executed.
2. In the `Threads` sub-window, if the file name and line number after each thread stack frame (where each stack frame represents a function call) are hyperlinks, it means they can be clicked to jump to the corresponding execution position. This usage is similar to the principle of a debugger in an IDE, so no further examples are provided.
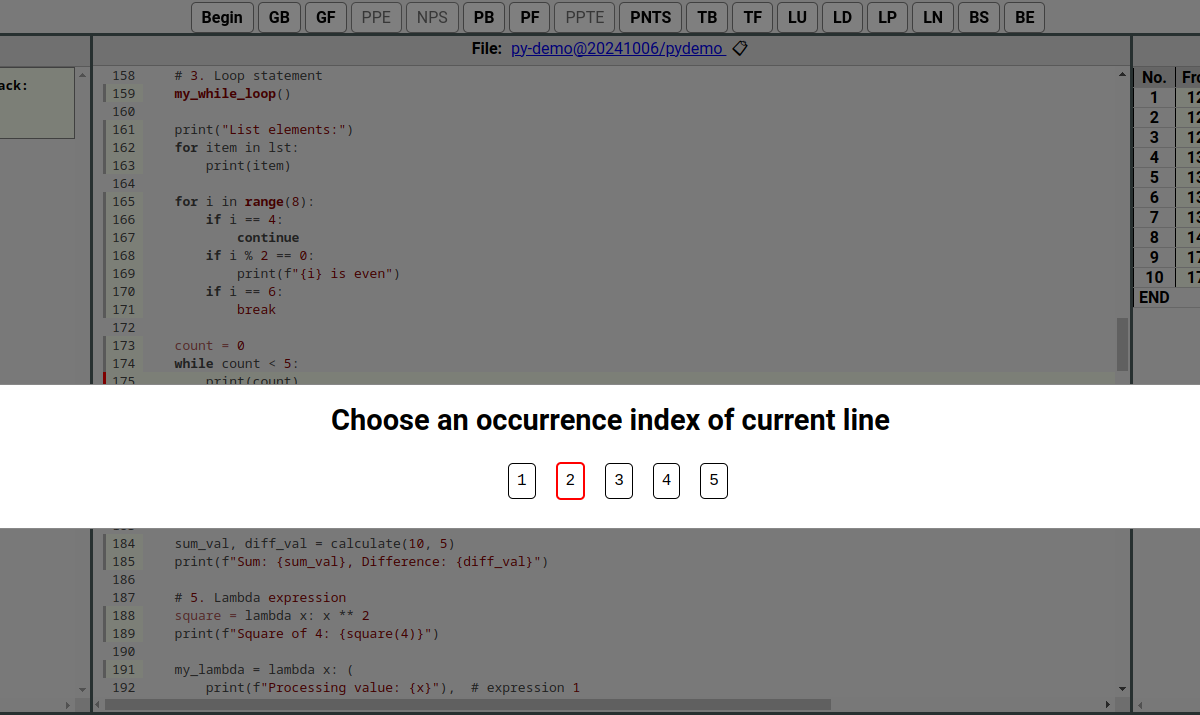
3. In the `File` sub-window which is titled with the path of current source file, code lines whose line number columns have highlighted background color same as the color of current thread can be double-clicked to directly jump to the clicked line. The meaning of a highlighted line of code is that the current thread has passed through these highlighted lines while executing the function containing those lines. In other words, lines that are not highlighted were not executed in the current thread when calling this function. There is a special case where a highlighted line is inside a loop and is executed multiple times during the function's execution. When double-clicking on such a line, a list will pop up, showing how many times the line has been executed in the current loop, and which iteration it is in. You can then click on a specific iteration to jump to the corresponding loop process, which is very convenient. For example, if we double-click on line 175 in the source code again, a dialog box "Choose an occurrence index of current line" will pop up. From this, we can see that the current position is the second loop iteration of the loop statement, and we can click on iterations 1, 3, 4, or 5 to jump to the execution position of the highlighted line in the corresponding loop iteration.
With the navigation shortcuts introduced above, even if a runtime process contains millions of execution steps, we can still quickly jump to the execution position we want.
Next, let's talk about the `Output` sub-window, which has two tabs on the left: Colorful and Plain, as shown in the figure below:
The Colorful tab is selected as default. It represents an output table with colored rows, where each row shows one line of output. The background color of each row indicates the corresponding thread, matching the colors of threads displayed in the `Threads` sub-window (the default background color of highlighted lines in the `File` sub-window also represents the current thread’s color).
The Plain tab shows the standard output of the current runtime without any background color and includes only the information output by the process up to the current execution point.
In general, we only need to look at the output table when the Colorful tab is selected, as it is more intuitive and includes all logs that have been output and those that will be output. Note: logs that have been output appear in bold, and a thick red line separates the logs that have been output from those that will be, marking the current execution position.
For now, this page may look somewhat simple, so next, we can demonstrate a more complex scenario: one involving multithreaded interleaved execution. The current `pydemo` program runtime happens to include multiple threads, which is reflected in the Colorful output table. By scrolling down with the mouse in this table, we can find an interleaved multithreading situation. Here, we see that the output position at line 85 represents a relatively complex scenario. Double-clicking the blank area of this line (avoid double-clicking the text, as that will only select the text and not trigger the jump) will take you to the state just before the line 85 print statement is executed.
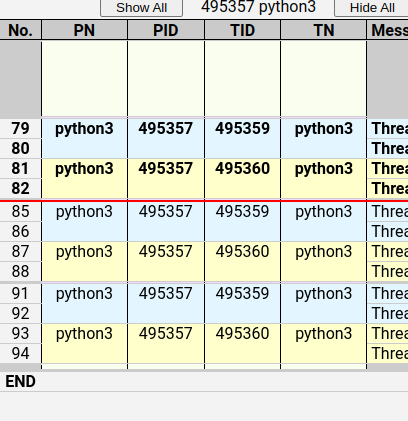
Additionally, as seen in the image above, there is a `Threads Filter` table above the output table. Each row in the filter table represents a process, with all of its threads listed in the thread column. If a process has multiple threads, you can display or hide all output from a particular thread in the output table below by selecting or deselecting the checkbox next to each thread. This is useful when there is a large amount of log output, as it allows you to display only the threads you are interested in. If we choose to display only the last two threads, the content in the output table will be much reduced, as shown in the figure below:
Note:The filter table can be shown or hidden using the `Filter` toggle switch in the upper-right corner of the `Output` sub-window. The `Merge` toggle switch to the right of `Filter` is used to merge or unmerge rows in the output table that belong to the same thread and contain identical column content.
Next, let's look at the `Variables` sub-window in the upper right of the page, which is used to display variable information for the current thread during the call to the current function. It primarily includes a list of input parameters and local variables with their corresponding values. The variable list accumulates, making it convenient to browse and compare all variable information.
That is all for the introduction to each feature in the interface. If you have any questions, feel free to email us at runtimehub.com@gmail.com or leave feedback in the comments section below the user guide video on our YouTube channel: RuntimeHub.
Thank you for watching. Goodbye!
